Work / Investigative visualization
Transaction Browser
An interactive tool for finding fraud in thirty years of bank transactions, built from scanned statements and messy records.
A large bank needed to review thirty years of transactions between accounts tied to one individual. They were looking for fraud. Nothing obvious stood out.
The problem
- A large number of transactions, each with many attributes.
- The data came from everywhere: scans of paper statements, and queries run by different branches. It all had to be normalized before anyone could trust it.
- The signs of fraud weren’t visible in a spreadsheet.
Approach
I cleaned and normalized the data in stages with Python scripts. Names were the hardest part. The same account holder could appear several different ways.
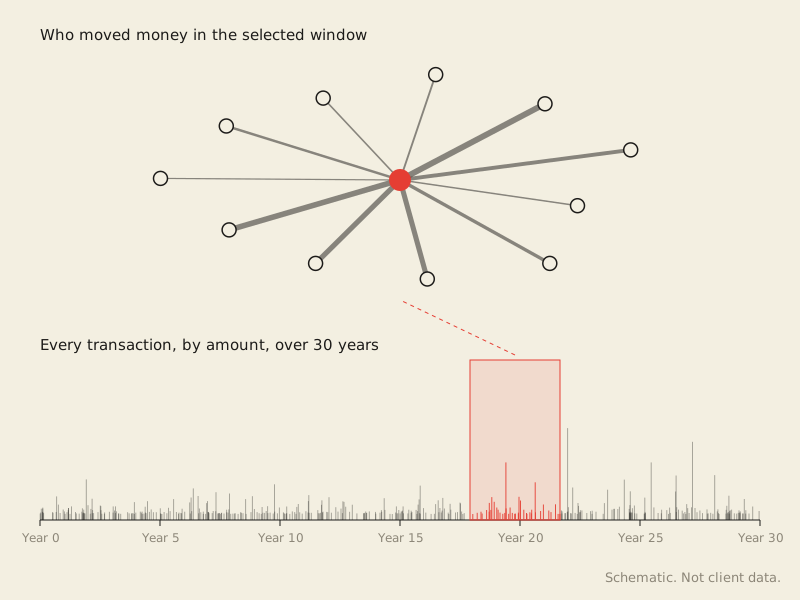
Then I built the tool around two things investigators care about first: when money moved, and how much. It has two linked views. A timeline plots every transaction by amount. Brushing across a stretch of the timeline builds a network graph of everyone who sent or received money in that window. A name filter catches the variant spellings.
Outcome
The client got the answers they needed. The tool also surfaced new questions and pointed to the places that needed more digging, which is what a good investigative tool should do.